
![]()
US Census Response Rates on American Indian Reservations in the 2020 Census and in the 2010 Census
Randall Akee
Paul Ong
Desi Rodriguez-Lonebear
May 15, 2020
The U.S. Census is the backbone of the U.S. official statistics system. A decennial census is constitutionally mandated to determine proportional representation in Congress. It also provides population counts that are used to allocate public services and funding across the country, and to calculate vital statistics estimates. In the time of the COVID-19 pandemic, U.S. Census data are crucial for understanding case and death rates as well. Currently, the U.S. Census Bureau is undertaking its 24th Census amid one of the most difficult enumeration periods in history. While the country faces dual threats of an economic shutdown and the public health pandemic, the decennial census is underway.
As a result, U.S. Census response rates may not be the highest priority for the country’s citizens. In prior Censuses, low response rates impacted certain populations: racial and ethnic minorities, children, those in poverty, and the highly mobile. A critical remedy is the use of Census enumerators who make direct house calls to non-response households. However, in-person enumerators may not be as viable in the time of a pandemic due to health risks to Census workers and households.
In particular, American Indian and Alaska Native nations and communities have some of the highest Census non-response rates decade after decade. There are many reasons for low rates of participation, including non-standard mailing addresses, antipathy towards the U.S. Government, and lack of familiarity with the agency and purpose of the Census, among others. To evaluate current levels of Census response among American Indian communities, we examined real time response data from the U.S. Census.
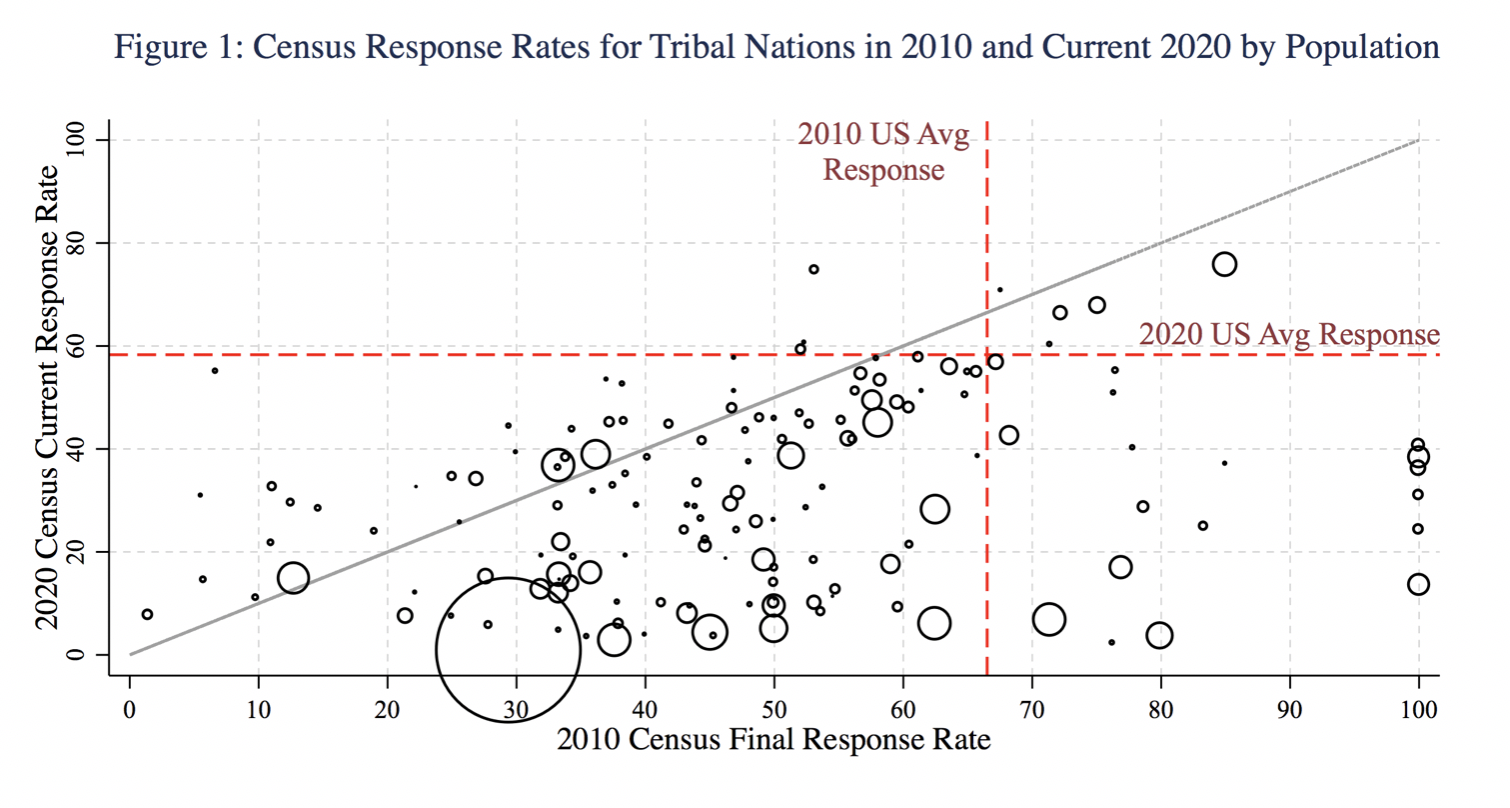
In the figure below, we take the American Indian tribal reservation response data provided as of May 13, 2020 and compare it to the 2010 response rate. The size of the circles reflects the size of the population on reservation for the AIAN alone population. We exclude Oklahoma tribes and Alaska Natives in this analysis. Additionally, we exclude those tribal reservations that have no information or have a zero recorded as a response rate in either time period.
The gray diagonal line, at a 45-degree angle, represents an equal response rate in 2010 and 2020 at the tribal level. Bubbles that fall below the line indicate that the current Census response rate is behind the historical 2010 response rate. To some extent, this would be expected as Census enumeration will continue for the rest of the year. The red vertical line at 67% indicates the 2010 response rate for the U.S. as a whole. The horizontal red line indicates the current completion rate for the U.S. as a whole in 2020, which is at 60% currently.
There appears to be seven tribal reservations that have response rates greater than the current national average (they are above the red horizontal line). The rest of the tribal reservations appear to have response rates that are currently below the U.S. national average. Historically, the majority of tribal reservations were below the U.S. average response rate which is evidenced by the high number of bubbles to the left of the red vertical line at 67%. Finally, the majority of tribal reservations are below their 2010 Census response rates at the current time period as illustrated by the majority of bubbles positioned below the gray 45-degree line.
The low self-response rate during the first phase of the 2020 Census will create major challenges for the second phase, the non-response follow-up in-person interviews. Low self-response means many more labor-intensive contacts will be needed, which is particularly difficult during the pandemic. Ultimately, this may produce a significant undercount of American Indians. It is critical that we act now to reduce the response gap as much as possible and to use updated information on the location and magnitude of the gap to more effectively guide outreach efforts in the near future. Partnerships with tribal nations to ensure full and accurate counts of American Indians on reservation lands are critical.
For further questions or inquiries please contact: Randall Akee, rakee@ucla.edu.
The list below provides the information as of May 13, 2020 for response rates on American Indian reservations for the 2020 US Census. We have matched it, where possible, to the 2010 Census Response rates. These data are all publicly available from the U.S. Census Bureau online: https://data.world/uscensusbureau/2020-census-response-rate-data.
| Tribe Name | ||
| Yomba | ||
| Los Coyotes | ||
| Mashpee Wampanoag | ||
| Passamaquoddy | ||
| Grindstone | ||
| Stewarts Point | ||
| Mesa Grande | ||
| Havasupai | ||
| Hopi | ||
| San Carlos | ||
| Big Cypress | ||
| Navajo Nation | ||
| Chemehuevi | ||
| Onondaga Nation | ||
| Gila River | ||
| Santo Domingo | ||
| Bridgeport | ||
| Kaibab | ||
| Rosebud | ||
| Fort Apache | ||
| Red Lake | ||
| Hollywood | ||
| Jicarilla Apache Nation | ||
| Northern Cheyenne | ||
| Benton Paiute | ||
| Crow | ||
| Lac Vieux Desert | ||
| Immokalee | ||
| La Jolla | ||
| XL Ranch | ||
| Soboba | ||
| Tohono O’odham Nation | ||
| Moapa River | ||
| Santa Ysabel | ||
| Pine Ridge | ||
| Timbi-Sha Shoshone | ||
| Rincon | ||
| Brighton | ||
| South Fork | ||
| Cheyenne River | ||
| Table Mountain | ||
| Fort Belknap | ||
| Pechanga | ||
| Iowa (KS-NE) | ||
| Lower Brule | ||
| Torres-Martinez | ||
| Round Valley | ||
| Fort Yuma | ||
| Indian Township | ||
| San Pasqual | ||
| Cahuilla | ||
| Turtle Mountain | ||
| Crow Creek | ||
| Pauma and Yuima | ||
| Goshute | ||
| Pala | ||
| Santa Rosa | ||
| Fort Pierce | ||
| Blackfeet | ||
| Laguna | ||
| Hoopa Valley | ||
| Zuni | ||
| Hualapai | ||
| Tonto Apache | ||
| Yavapai-Apache Nation | ||
| Acoma | ||
| Santee | ||
| Lone Pine | ||
| Yavapai-Prescott | ||
| Picuris | ||
| Duck Valley | ||
| Yurok | ||
| Pleasant Point | ||
| Fort Bidwell | ||
| Menominee | ||
| Isleta | ||
| Wells | ||
| Colorado River | ||
| Fort Berthold | ||
| Tuscarora Nation | ||
| Annette Island | ||
| Flandreau | ||
| Coushatta | ||
| Rocky Boy’s | ||
| Cocopah | ||
| Spirit Lake | ||
| Manchester-Point Arena | ||
| Fort McDermitt | ||
| Manzanita | ||
| Ohkay Owingeh | ||
| Standing Rock | ||
| Tuolumne | ||
| Oneida Nation | ||
| San Felipe | ||
| Uintah and Ouray | ||
| Winnemucca | ||
| Bois Forte | ||
| St. Regis Mohawk | ||
| Big Pine | ||
| Zia | ||
| Spokane | ||
| Mescalero | ||
| Makah | ||
| Taos | ||
| Fort Peck | ||
| Tesuque | ||
| Laytonville | ||
| Santa Clara | ||
| Eastern Cherokee | ||
| Walker River | ||
| Picayune | ||
| Grand Portage | ||
| Ute Mountain | ||
| Lac du Flambeau | ||
| Leech Lake | ||
| Big Sandy | ||
| Warm Springs | ||
| Duckwater | ||
| Poarch Creek | ||
| Jemez | ||
| White Earth | ||
| Santa Ana | ||
| Winnebago | ||
| Yankton | ||
| Lovelock | ||
| Wampanoag-Aquinnah | ||
| Colville | ||
| Lake Traverse | ||
| Karuk | ||
| Rumsey | ||
| Kickapoo (TX) | ||
| Sac and Fox Nation | ||
| Kalispel | ||
| Shingle Springs | ||
| Redding | ||
| Campo | ||
| Fort Hall | ||
| Sokaogon Chippewa | ||
| North Fork | ||
| Pyramid Lake Paiute | ||
| Tonawanda | ||
| Battle Mountain | ||
| Quinault | ||
| Chitimacha | ||
| Mashantucket Pequot | ||
| Viejas | ||
| Cattaraugus | ||
| Susanville | ||
| Lac Courte Oreilles | ||
| San Ildefonso | ||
| Omaha | ||
| Trinidad | ||
| Pojoaque | ||
| Santa Ynez | ||
| Sandia | ||
| Santa Rosa | ||
| Nambe | ||
| Upper Lake | ||
| Tule River | ||
| San Manuel | ||
| Upper Skagit | ||
| Wind River | ||
| Blue Lake | ||
| St. Croix | ||
| Osage | ||
| Big Valley | ||
| Morongo | ||
| Berry Creek | ||
| Ysleta del Sur | ||
| Smith River | ||
| Cabazon | ||
| Kickapoo (KS) | ||
| Cow Creek | ||
| Hoh | ||
| Southern Ute | ||
| Robinson | ||
| Cold Springs | ||
| Klamath | ||
| Fort Mojave | ||
| Prairie Band of Potawatomi Nation | ||
| Ho-Chunk Nation | ||
| Burns Paiute | ||
| Yerington | ||
| Tunica-Biloxi | ||
| Barona | ||
| Dresslerville | ||
| Rohnerville (Rancheria) | ||
| Hopland | ||
| Bad River | ||
| Paiute (UT) | ||
| Cochiti | ||
| Mille Lacs | ||
| Chehalis | ||
| Prairie Island | ||
| Fort Independence | ||
| Houlton Maliseet | ||
| Coeur d’Alene | ||
| Guidiville | ||
| Flathead | ||
| Huron Potawatomi | ||
| Las Vegas | ||
| Maricopa (Ak Chin) | ||
| Sac and Fox/Meskwaki | ||
| Pascua Pueblo Yaqui | ||
| Fort McDowell Yavapai Nation | ||
| Aroostook Band of Micmac | ||
| Quileute | ||
| Salt River | ||
| Elk Valley | ||
| Mississippi Choctaw | ||
| Penobscot | ||
| Sauk-Suiattle | ||
| Bishop | ||
| Little River | ||
| Reno-Sparks | ||
| Sycuan | ||
| Skokomish | ||
| Hannahville | ||
| Allegany | ||
| Siletz | ||
| Nez Perce | ||
| Pinoleville | ||
| Sherwood Valley | ||
| Carson | ||
| Upper Sioux | ||
| Coyote Valley | ||
| Alabama-Coushatta | ||
| Grand Ronde | ||
| Yakama Nation | ||
| Nooksack | ||
| Squaxin Island | ||
| Woodfords | ||
| Grand Traverse | ||
| Quartz Valley | ||
| Lower Sioux | ||
| Shakopee Mdewakanton Sioux | ||
| Agua Caliente | ||
| Lower Elwha | ||
| Catawba | ||
| Fallon Paiute-Shoshone | ||
| Campbell | ||
| Umatilla | ||
| Lummi | ||
| Elko | ||
| Redwood Valley | ||
| Mooretown | ||
| Shoalwater Bay | ||
| Little Traverse Bay | ||
| Nisqually | ||
| Table Bluff | ||
| Stewart | ||
| Muckleshoot | ||
| Colusa | ||
| Bay Mills | ||
| L’Anse | ||
| Fallon Paiute-Shoshone | ||
| Coquille | ||
| Celilo | ||
| Ely | ||
| Tulalip | ||
| Fond du Lac | ||
| Coos, Lower Umpqua, and Siuslaw | ||
| Mohegan | ||
| Swinomish | ||
| Port Madison | ||
| Washoe Ranches | ||
| Kootenai | ||
| Puyallup | ||
| Isabella | ||
| Pokagon | ||
| Port Gamble | ||
| Oneida (WI) |